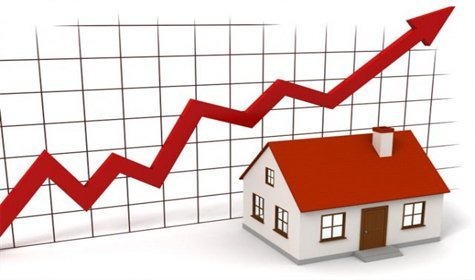
Home prices rise once again, bringing relief to homeowners but creating more challenges for buyers across the country. According to the National Association of REALTORS® (NAR), 77% of the nation’s 230 metro markets saw prices climb in the third quarter, slightly up from 75% in the previous quarter. The national median price for a single-family existing home reached $426,800—up 1.7% from last year.
“Prices continue to rise, contributing to record-high housing wealth,” says Lawrence Yun, NAR’s chief economist. In just five years, homeowners have gained an average of $140,900 in equity. That rising wealth is fueling a record number of cash buyers, who accounted for 30% of all home sales in September, NAR reports.
Yun notes that the sharpest home price increases occurred in areas where inventory is tight, particularly in the Northeast and parts of the Midwest where homes remain more affordable.
NAR’s data shows these metro areas had the largest year-over-year price gains in the third quarter:
Trenton, N.J.: +9.9%
Lansing-East Lansing, Mich.: +9.8%
Nassau County–Suffolk County, N.Y.: +9.4%
New Haven–Milford, Conn.: +9%
New York–Jersey City–White Plains, N.Y.–N.J.: +8.1%
Manchester–Nashua, N.H.: +8%
St. Louis, Mo.–Ill.: +7.9%
Bridgeport–Stamford–Norwalk, Conn.: +7.8%
Toledo, Ohio: +7.7%
Cleveland–Elyria, Ohio: +7.7%
In the Northeast, prices jumped 6% year-over-year to a median of $540,100. The Midwest followed with a 4.2% gain to $331,100. The South saw a smaller 0.5% increase to $372,800, while the West experienced a 0.1% decline to $633,900. Overall, 23% of metro areas recorded price drops—slightly fewer than the prior quarter’s 24%.
“Price declines are mainly in southern states where new home construction has surged,” Yun explains. “Given strong job growth in the region, these price drops are likely temporary and offer second-chance opportunities for buyers.”
While home prices rise, affordability remains a key hurdle. Mortgage rates have eased from around 7% to the mid-6% range, offering slight relief but not enough to counter higher prices. The typical monthly mortgage payment for a single-family home with 20% down is $2,187—down 2.8% from the second quarter but still 2.2% higher than a year ago.
First-time home buyers are being squeezed hardest. NAR’s 2025 Profile of Home Buyers and Sellers found their share of the market has dropped to 21%, the lowest since 1981. Before 2008, first-time buyers made up about 40% of sales, but low inventory and rising prices have kept many on the sidelines.
For those who do buy, the cost burden is real. The typical starter home now costs $362,800, with a monthly payment of $2,146 (10% down). That means first-time buyers are spending 37.4% of their income on housing—well above the affordable threshold.
The nation’s most expensive housing markets remain concentrated along the West Coast. Leading the list are:
San Jose-Sunnyvale-Santa Clara, Calif.: $1.9 million (up 0.8%)
Anaheim-Santa Ana-Irvine, Calif.: $1.4 million (up 0.1%)
San Francisco-Oakland-Hayward, Calif.: $1.3 million (up 0.5%)
Urban Honolulu, Hawaii: $1.1 million (down 0.9%)
Salinas, Calif.: $1 million (up 6.3%)
San Diego-Carlsbad, Calif.: $1 million (no change)
Los Angeles-Long Beach-Glendale, Calif.: $954,100 (up 0.7%)
Oxnard-Thousand Oaks-Ventura, Calif.: $935,700 (down 1.2%)
San Luis Obispo-Paso Robles, Calif.: $931,800 (down 1.9%)
Bridgeport-Stamford-Norwalk, Conn.: $844,900 (up 7.8%)
As home prices rise, the divide between affordable and high-cost markets continues to widen—making housing wealth a growing advantage for owners and a major barrier for aspiring buyers.